English Online Help Topic Trend (F5)
6.6.1 Trend (F5)
With the trend function of SiDiary you are able to analyze your tracked values
and review them with common smiley-buttons. In this process the two time ranges
will be compared to each other. So you can see very clear where you have
improved so far and where more improvement is needed.
The icons indicate as well the change of the values in both time ranges
(trend-cursor) and a rating with the smiley’s (“Emoticons”) of the particular
category.
The three most important categories, a person
with diabetic needs to take care of, are: the categorical blood sugar
adjustment should be kept on a low level, which you can see in the “A1C”
information. Also the values shouldn’t be in a high variability, which can be
seen in the standard deviation. The 3rd factor is the postprandial
situation of the values, which means the blood glucose level peaks after carb
intake. These short peaks should be avoided, too (because of the negative
effect on the vessels).
In addition to these 3 categories the frequency
of blood glucose measurings is important. The frequency should be accurate – so
the analysis of the other categories can achieve realistic and useful results
at all.
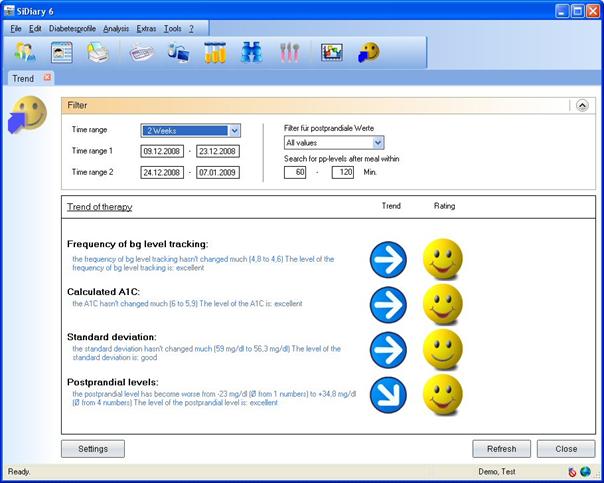
In the dropdown list Filter you
are able to define rules for the analysis. You can select a free time range or
predefined time ranges. If you select the predefined time range, you see below
the information for time range 1 and time range 2. Please consider that both
time ranges have always the same number of days. The Filter for pp-levels (pp =
postprandial / after meal) allows you a fine adjustment.
|
Hint |
You are able to
“filter” the diagnosis for the postprandial situation. For example: When you
are interested in the postprandial situation of the morning, noon or evening.
Usually the filter is not set for a time of day, so all located postprandial
values can be analyzed. |
You can also define when a blood glucose value should stand for a
pp-measuring (in minutes after the entry of the bolus insulin). The division
into the categories excellent, good,
satisfactory and poor based on therapeutic targets, which you have defined
with your doctor or your diabetologist.
You can setup the definition of the targets or the limit values, which decide
about the rating of the categories, in the same settings screen with the same
button:
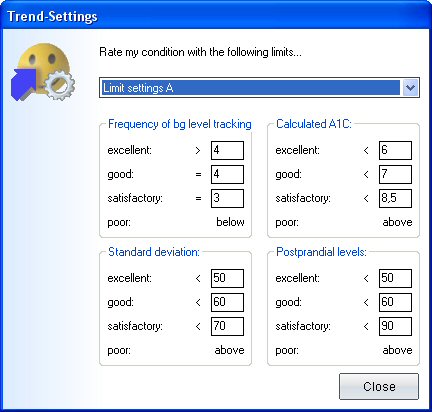
You can preset the limit values, by selecting Limit settings A, B or C, so
you set the limit values on predefined values. But of course you can adjust
each value to match your personal needs or the suggestions of your doctor.
The analysis function identifies the values for the rating of the
pp-situation automatically. SiDiary searches first of all for a fasting blood glucose reading, which
is tracked together with a carb intake and a bolus injection (or pill). If this
initial value is over 200 mg/dl it won’t be used for the pp-analysis, because
there could be a too high influence of the correction quota of the
blood-glucose-lowering pill or insulin.
If it’s below from 200 mg/dl, then the program is searching a blood
glucose level, which is in a range of X-Y minutes (depending on your settings)
after the fasting situation. The difference between the searched values shows
the "before-and-after-variation"
The postprandial variation doesn't always need to be positive. Sometimes
it can happen that you have estimated a wrong carb intake or the carb ratio is
not yet defined correct and you will have a blood glucose decrease. SiDiary
will show such a decrease with a negative number.
By clicking
postprandial situation you can view a
list of the days and times for which SiDiary found pp-situations. SiDiary
automatically includes the pp-situations with the average value of all found
values in the statistics.
Among the various parameters you can find a text with a detailed analysis. The arrows indicate the
trend of the development:
-
Arrow upwards = time range 2 is better than time range
1
-
Arrow to the right = the results of both time ranges
are about the same
-
Arrow downwards = time range 2 is worse than time
range 1
The smiley’s always rate the current state in time range 2.