English Online Help Topic Layout and colors
6.7.3.3 Layout and colors
In this area you can adjust the
appearance of SiDiary:
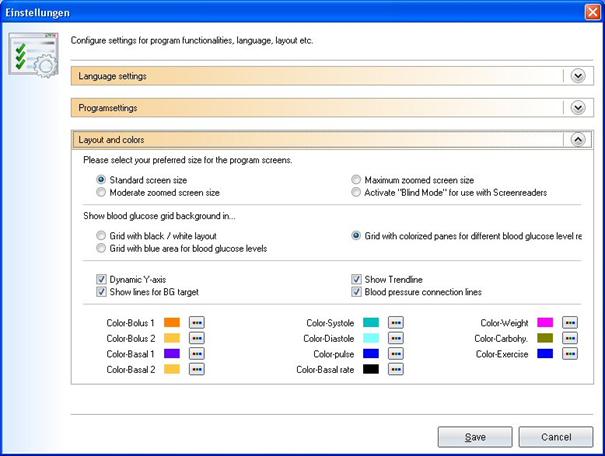
You can enlarge program elements
like buttons and program text in two steps (moderate zoomed and maximum
zoomed). Please notice, that the zoom does not affect the displayed size of the
detail logbook.
For blind persons you can select the
Blind mode for use with Screenreaders, which
will optimize the display for Screen-Readers.
Show blood glucose grid background in: The overview in the detail-logbook can be
displayed in different colors. Besides a design in black/white or blue you can
display the different target ranges (under the target range, in the target range,
a bit over the target range and high values) each in different colors. Your own
adjusted target range will always be displayed in the color green.
Below that you can make your
settings for the graphical display in the statistics. You can find the
description of the line settings in chapter 6.6.2.9 „Go to Settings page“
You can also adjust the colors of
the display of additional information in graphics of the statistics. To change
a color, please click on the button with the three points and the following
screen will open:
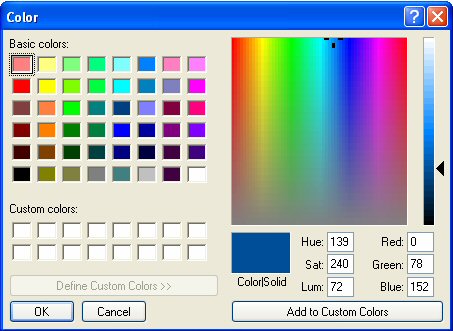
Here you can adjust every color that
you like.