English Online Help Topic Statistics (F6)
6.6.2 Statistics (F6)
In the statistics you are able to analyze your tracked data (including your
own data types and lab values) and display the data in graphs. It is possible
to use your recorded events as a filter.
Please notice: The larger the data volume, the longer SiDiary will need to
analyze your data. Especially on mobile devices an analysis with the option
“all values” can take very long. The calculation is much faster on the
Windows-platform, so even large data volumes can be selected.
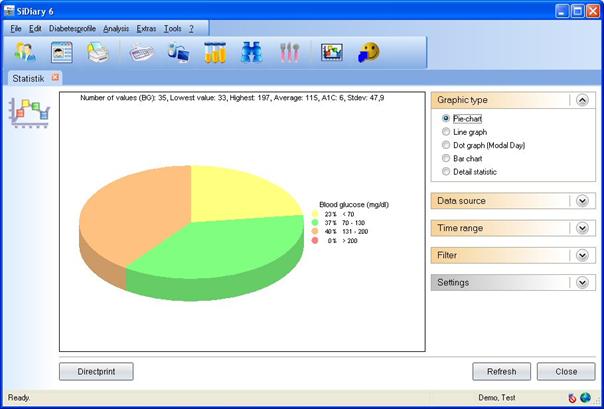
In addition to the displayed graphic type above (pie chart) you can also
choose between a line graph, a dot graph, a bar chart and a detail statistic in
text form (see examples below).
With a click at Directprint you
can print the shown graphic directly with your standard printer.
|
Hint |
In the line graph and
dot graph you can get for each measuring point, time and date the exact
measured value as a tooltip-display, when you move the mouse across the
graphic. If you click on an exact dot the logbook opens the exact day with
this value. So you are
able to check how this value occurred. |
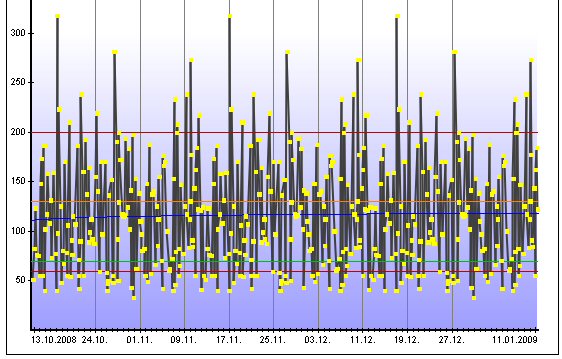
Zoomfunction
The integrated zoom function of the
statistic is really helpful if you want to look at a graph with a lot of data.
At first view a graph with a lot of data can be very unclear:
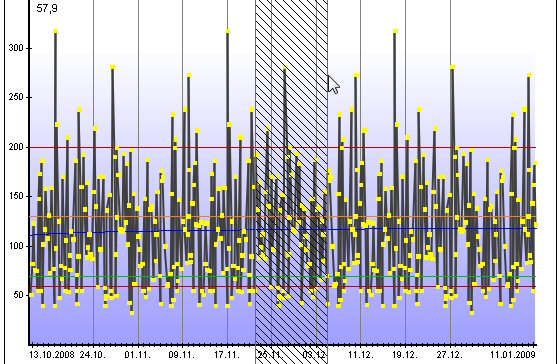
Just click with your cursor arrow in
the area you want to see and drag it larger with the left mouse button
pressed.
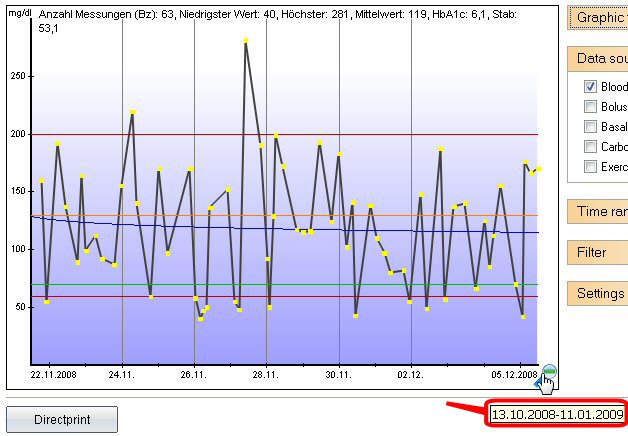
This area will now be displayed
larger (zoomed), so you are able to see the details better. Of course you are
also able to zoom in an already zoomed area. You can see at the bottom of the
picture a lens icon with a (-) minus symbol. By clicking on this icon the graph
will be displayed in the last shown size again. The time range to that you get
back will be displayed additionally as a tooltip (see also the red mark).
Graphic Types