"MANTENIENDO TUS DATOS AL DIA DE LA MANERA FACIL" SiDiary apoya el control de la diabetes con la terapia de bomba
Un cambio en la terapia o un ajuste en la bomba de insulina se realiza preferiblemente en casa porque ahí es donde tienes todas las condiciones 'reales'. No obstante, puede ser interesante proveer a tu medico con tus datos al mismo tiempo. Con el libro de registro »»»
"MUY FACIL - HASTA PAPA PUEDE USARLO" SiDiary apoya a los niños y adolecentes con diabetes
Si tus hijos están fuera de casa y detectan una lectura crítica, los padres pueden ser informados con un mensaje SMS directo a sus móviles. Ellos pueden llamar al niño con instrucciones sobre como manejar la situación. La persona responsable y el número de teléfono junto con algunos otros »»»
"SINTIENDOSE MUY BIEN" SiDiary te apoya con la diabetes gestacional
Los niveles altos de glucosa son transferidos a través del cordón umbilical al bebé que empieza a producir más insulina para almacenar el exceso de glucosa en forma de grasa. El peso al nacer de este tipo de bebés puede ser de hasta 4,5 kilos por encima de la media. Obviame »»»
"¡LA EDAD ES SÓLO UN NÚMERO - SE PROACTIVO!" SiDiary te apoya con la diabetes tipo 2
Muy pocos softwares ofrecen la posibilidad de hacer un seguimiento de las pastillas así como de la insulina en combinación. Con SiDiary puedes hacer el seguimiento de la información de cuando te has tomado las pastillas, cuantas te has tomado y además cuando te inyectaste la insulina.
»»»
"VIVIENDO UNA VIDA SENCILLA CON DIABETES" SiDiary te apoya con la diabetes tipo 1
Esto significa que deben inyectarse insulina de larga duración para suplir sus necesidades basales e inyecciones adicionales de acción rápida para cada ingesta de carbohidratos.
- Antes de cada ingesta de carbohidratos
- Por la noche antes de ir a la cama
»»»
"GESTIONA LA DIABETES CON SIDIARY" Tu gestión inteligente de la diabetes
SiDiary hace que el control de la diabetes sea mucho más fácil. La introducción de datos es muy sencilla y el análisis te ayudara a mejorar tu tratamiento. Hemos añadido grandes mejoras en la versión 6 para ayudarte a utilizarla de la manera más útil posible, incluso para novatos de la informática!
»»»
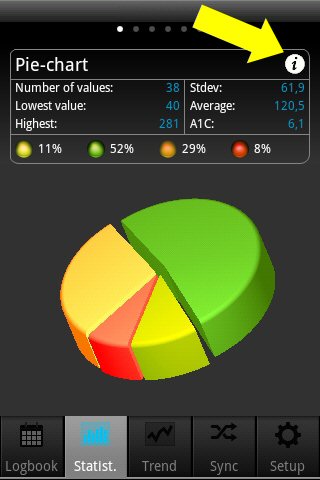
First you see the pie chart in the statistcs with the spreading of all your blood glucose measurements.
All values within your target range are green, yellow means you are below your target range, orange means above your target range and red means more
than 200 mg/dl (11,1 mmol/l).
Above the pie chart you see more details regarding this time range: Number of values, standard
deviation, calculated A1C and so on. With a movement of your finger to the left you see the other graphs; with a tap on the i-symbol you will enter
the statistics settings...
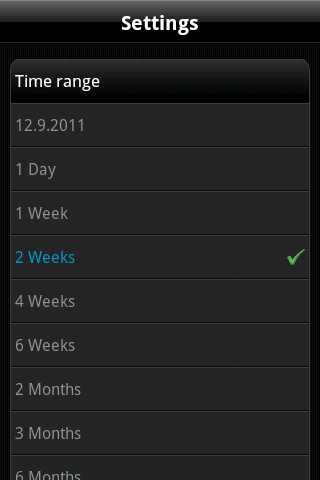
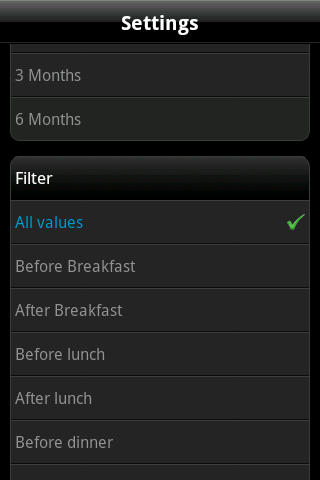
In the statistics settings you can set the time range for the statistic and which parts of
a day should be processed.
.....
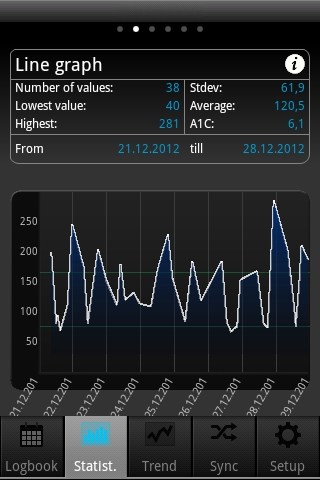
In the line graph you see the curve progression of your blood glucose measurements for the selected time range.
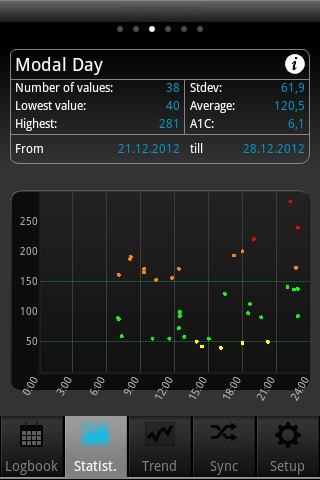
The modal day shows you all measurements of your selected time range projected to a 24 hour day. So you have a quick overview in which parts of the day
you have measured mostly and when the values have the biggest spread. In the example on the left you can see that in the evening between 15:00 and
21:00 the spread is the biggest, which means the blood glucose is here mostly instable.
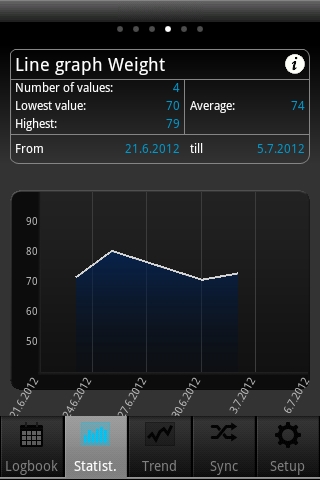
The line graph Weight will show you a curve of the development of your body weight.
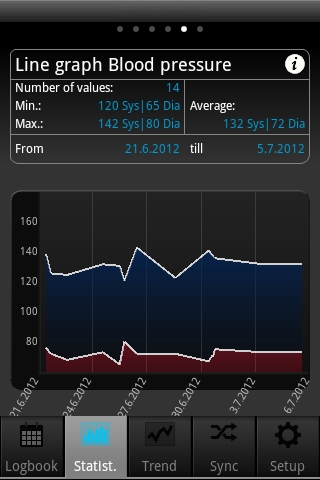
The line graph blood pressure shows you graphically how your blood pressure develops. The blue area shows the so-called 'amplitude', i.e. the difference
between the upper (systolic) and lower value (diastole).
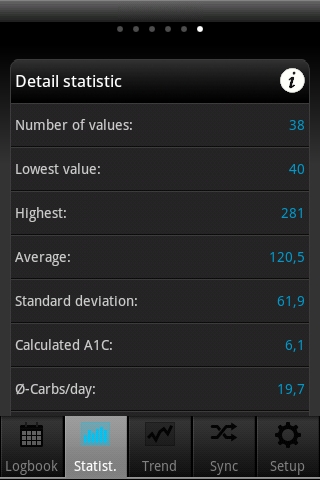
Additionally to the details from the previous graph screens the detail statistic shows more utilization like
the average values of carbs, bolus or basal insulin.
This website uses cookies to provide the best experience on our website. You can change your cookie settings at any time. If you continue without changing the cookie settings, we assume that you agree that this site may store cookies on your computer.