


SiDiary for Android - Manual - Trend
(Please click here to download the manual in PDF format)Content:
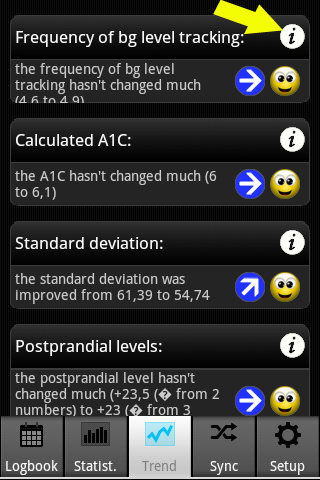 |
The trend analysis compares two time ranges to analyze the progression. Parameters are: Frequency (of bg level tracking), calculated A1C,
standard deviation and postprandial levels (bg level after meals).
If you select '1 Week' in the settings for the analysis, then the last 7 days will be compared with the previous 7 days. |
The set of criteria for the level:
| ... | Excellent | Good | Satisfactory |
| Frequency: | More than 3 | equal to 3 | less than 3 |
| Calculated A1C: | less than 6,5% | less than 7,5% | less than 9% |
| Standard deviation: | less than 60 mg/dl (3,3 mmol/l) | less than 70 mg/dl (3,9 mmol/l) | less than 80 mg/dl (4,4 mmol/l) |
| Postprandial level: | less than 60 mg/dl (3,3 mmol/l) | less than 80 mg/dl (4,4 mmol/l) | less than 100 mg/dl (5,5 mmol/l) |
A blood glucose value will be calculated as 'postprandial' if the measurement comes 60-120 minutes after an entry for carbohydrates.
In the settings for 'Trends' (via the i-symbol at the top) you can select which time ranges should be calculated and which parts of a day you want to analyze for the postprandial levels.The parts of day are:
- After breakfast: 10:00 - 11:59 (10:00am - 11:59am)
- After lunch: 15:00 - 16:59 (03:00pm - 04:59pm)
- After dinner: 20:00 - 03:59 (08:00pm - 03:59am)


